Fourier Transform Frequency Domain, Sound Power Analysis Software


Download Demo

Order Now


Curve fitting

Frequency Analysis

Unit Converter

Function Plotting

3D Plotting

2D Plotting

Calculator

Data Tables

Distribution Plotting

XY Plotting

Sound Analysis

Physics Constants

Reviews


Home

Contact Us

About

Guest Book


The frequency analysis software tool allows you to record sound from your computer microphone or import data using a text file.   This tool allows you to alter parameters on the left while updating the plot REAL TIME.    It has special plot tools for you to zoom in/out. 


The wave forms of your data are shown on the top plot in yellow, and the frequency spectrum (Fourier Transform Analysis) on the lower plot.


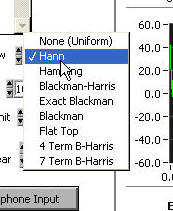
You are able to select from the following techniques: Hann, Hamming, Blackman-Harris, Blackman, Flat Top, 4 Term 
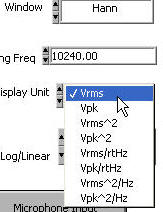
B-Harris, 7 Term B-Harris.   You also have the ability to display your data  using one of these display units: Vrms, Vpk, Vrms^2, Vpk^2, Vrms/rtHz,Vpk/rtHz, Vrms^2/Hz, Vpk^2/Hz.


STEP1
Import your raw data using a text file or your microphone / audio  sound card. Below is an example of what the data looks like once loaded into the data table.
Import text data for frequency analysis 2d3d calculator software


STEP2
Click on the "TRNASFORM" button.  Then choose a technique or window for you frequency analysis
2d3d calculator software frequency Hamming blackman harris analysis


STEP3
Choose a display unit
2d3d calculator software  frequency analysis software units


STEP4

View Data

(screen shot)